The mhpca package is a tool for conducting Multilevel Hybrid Principal Component Analysis (M-HPCA) proposed in Campos et al. (202?). This package contains the functions necessary to estimate the marginal eigenfunctions, eigenvectors, and product eigencomponents as well as the tools for performing inference.
Installation
You can install the development version from GitHub with:
# install.packages("devtools")
devtools::install_github("emjcampos/mhpca")
Example
Begin by loading the mhpca package.
library(mhpca) The data must be in the following form, with columns labeled Repetition, Group, Subject, reg, func, and y.
head(data)
#>     Repetition   Group    Subject reg       func        y
#> 1 Repetition 1 Group 1 Subject 01 E01 0.00000000 2.220561
#> 2 Repetition 1 Group 1 Subject 01 E01 0.02040816 2.373132
#> 3 Repetition 1 Group 1 Subject 01 E01 0.04081633 1.827891
#> 4 Repetition 1 Group 1 Subject 01 E01 0.06122449 2.443057
#> 5 Repetition 1 Group 1 Subject 01 E01 0.08163265 1.583508
#> 6 Repetition 1 Group 1 Subject 01 E01 0.10204082 1.705329
Using the MHPCA_decomp function, you can estimate the model components.
MHPCA = MHPCA_decomp(data, fve_cutoff = 0.8, nknots = 5)All of the components can then be plotted and inspected.
ggplot(data.frame(func = unique(data$func), mu = MHPCA$mu)) +
  geom_line(aes(x = func, y = mu))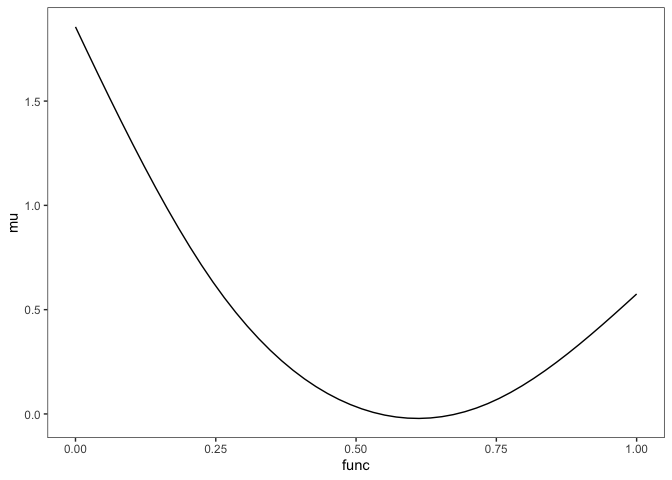
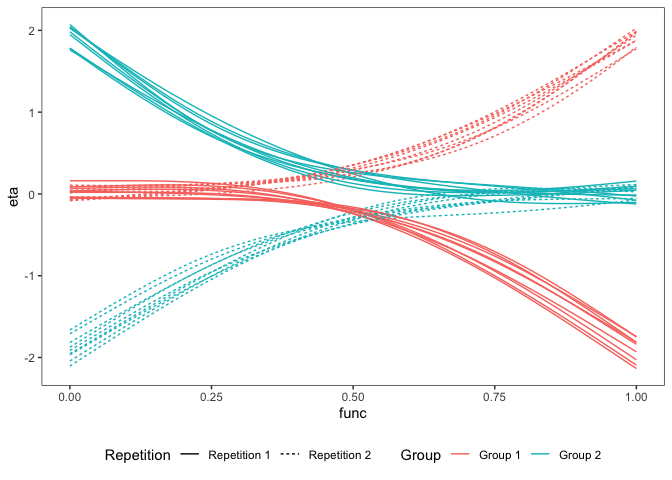
ggplot(MHPCA$eta) +
  geom_line(aes(
    x = func, y = eta,
    color = Group,
    linetype = Repetition,
    group = interaction(Group, Repetition, reg)
  ))
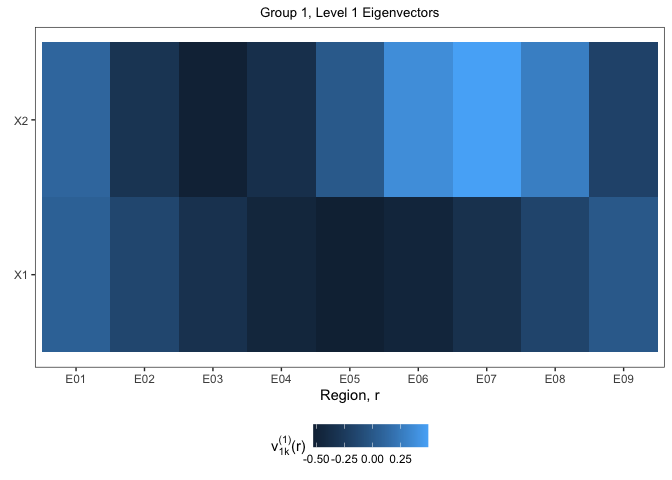
data.frame(MHPCA$marg$between$regional$`Group 1`$eigendecomp$vectors[, 1:2]) %>%
mutate(reg = unique(data$reg)) %>%
pivot_longer(X1:X2, names_to = "v") %>%
ggplot() +
geom_tile(aes(x = reg, fill = value, y = v)) +
labs(
x = "Region, r",
y = element_blank(),
fill = TeX("$v^{(1)}_{1k}(r)$"),
title = "Group 1, Level 1 Eigenvectors"
)
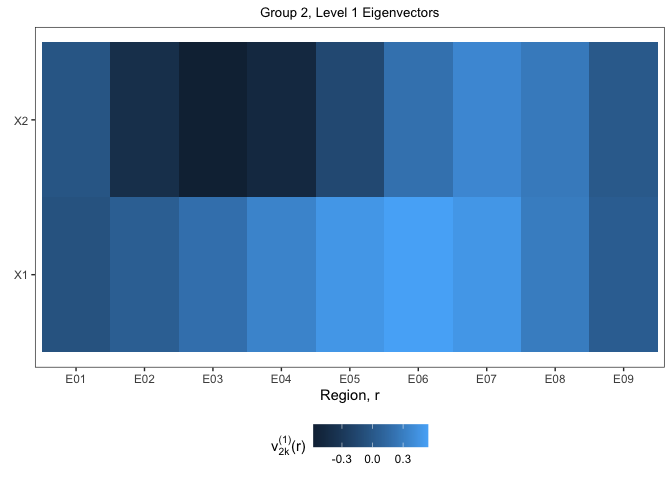
data.frame(MHPCA$marg$between$regional$`Group 2`$eigendecomp$vectors[, 1:2]) %>%
mutate(reg = unique(data$reg)) %>%
pivot_longer(X1:X2, names_to = "v") %>%
ggplot() +
geom_tile(aes(x = reg, fill = value, y = v)) +
labs(
x = "Region, r",
y = element_blank(),
fill = TeX("$v^{(1)}_{2k}(r)$"),
title = "Group 2, Level 1 Eigenvectors"
)
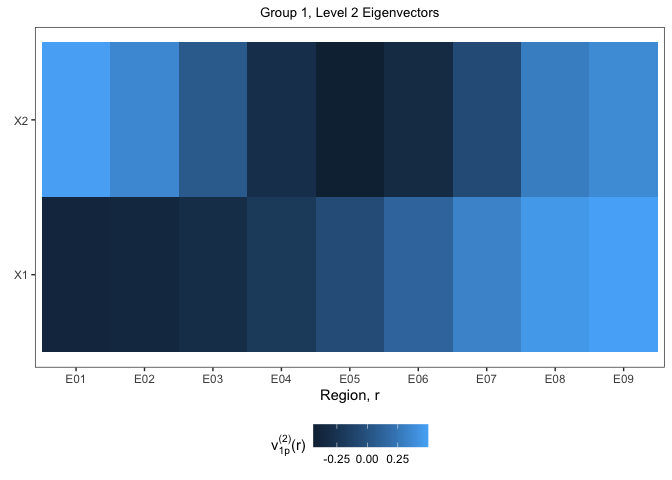
data.frame(MHPCA$marg$within$regional$`Group 1`$eigendecomp$vectors[, 1:2]) %>%
mutate(reg = unique(data$reg)) %>%
pivot_longer(X1:X2, names_to = "v") %>%
ggplot() +
geom_tile(aes(x = reg, fill = value, y = v)) +
labs(
x = "Region, r",
y = element_blank(),
fill = TeX("$v^{(2)}_{1p}(r)$"),
title = "Group 1, Level 2 Eigenvectors"
)
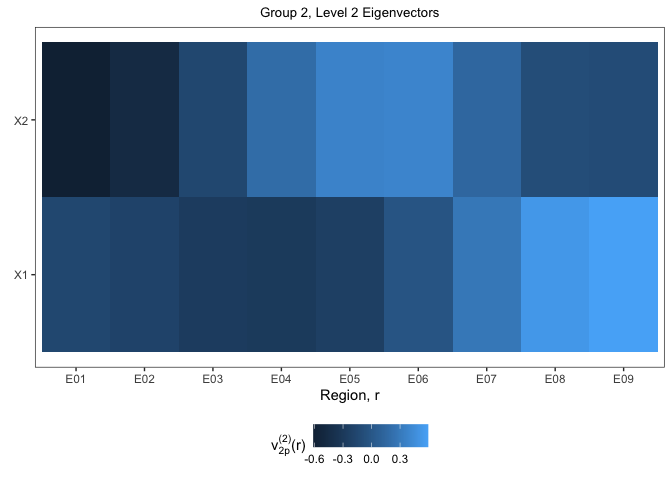
data.frame(MHPCA$marg$within$regional$`Group 2`$eigendecomp$vectors[, 1:2]) %>%
mutate(reg = unique(data$reg)) %>%
pivot_longer(X1:X2, names_to = "v") %>%
ggplot() +
geom_tile(aes(x = reg, fill = value, y = v)) +
labs(
x = "Region, r",
y = element_blank(),
fill = TeX("$v^{(2)}_{2p}(r)$"),
title = "Group 2, Level 2 Eigenvectors"
)
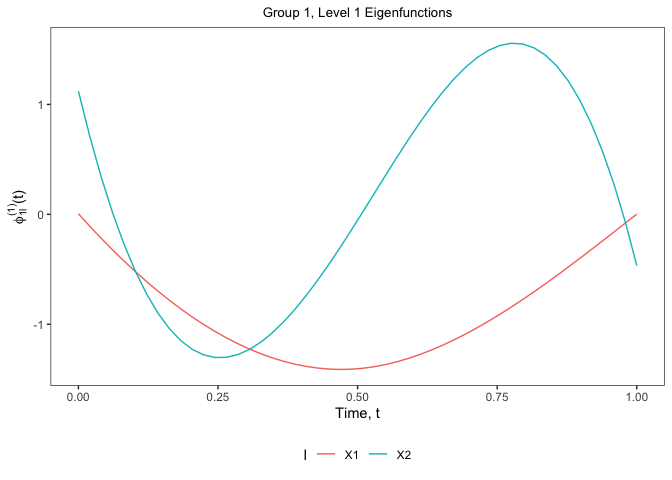
data.frame(MHPCA$marg$between$functional$`Group 1`$eigendecomp$vectors[, 1:2]) %>%
mutate(func = unique(data$func)) %>%
pivot_longer(X1:X2, names_to = "phi") %>%
ggplot() +
geom_line(aes(x = func, y = value, color = phi)) +
labs(
x = "Time, t",
y = TeX("$\\phi_{1l}^{(1)}(t)$"),
color = TeX("$l$"),
title = "Group 1, Level 1 Eigenfunctions"
)
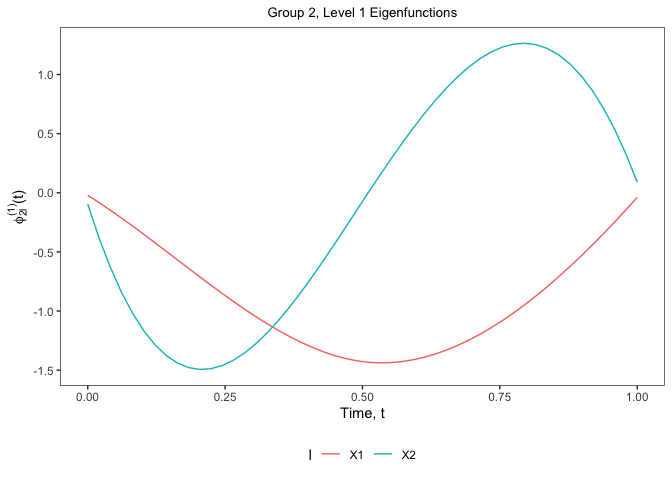
data.frame(MHPCA$marg$between$functional$`Group 2`$eigendecomp$vectors[, 1:2]) %>%
mutate(func = unique(data$func)) %>%
pivot_longer(X1:X2, names_to = "phi") %>%
ggplot() +
geom_line(aes(x = func, y = value, color = phi)) +
labs(
x = "Time, t",
y = TeX("$\\phi_{2l}^{(1)}(t)$"),
color = TeX("$l$"),
title = "Group 2, Level 1 Eigenfunctions"
)
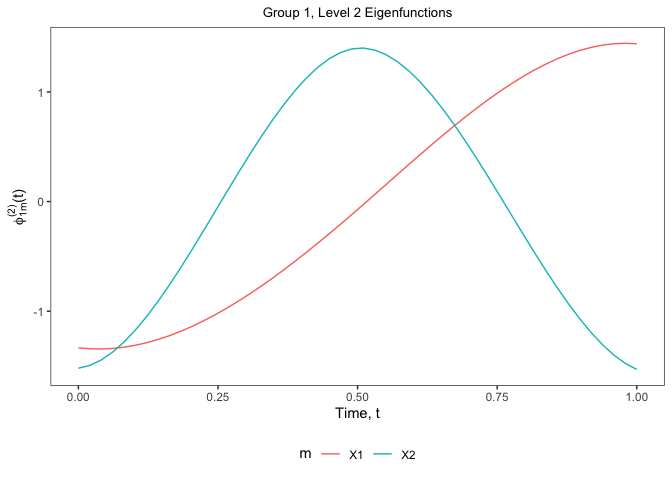
data.frame(MHPCA$marg$within$functional$`Group 1`$eigendecomp$vectors[, 1:2]) %>%
mutate(func = unique(data$func)) %>%
pivot_longer(X1:X2, names_to = "phi") %>%
ggplot() +
geom_line(aes(x = func, y = value, color = phi)) +
labs(
x = "Time, t",
y = TeX("$\\phi_{1m}^{(2)}(t)$"),
color = TeX("$m$"),
title = "Group 1, Level 2 Eigenfunctions"
)
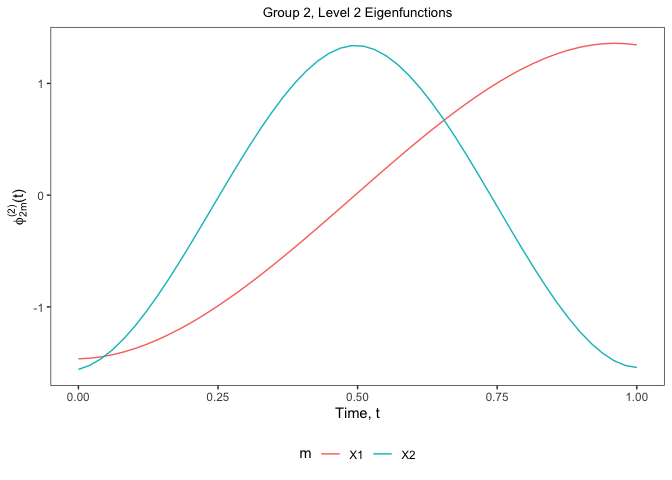
data.frame(MHPCA$marg$within$functional$`Group 2`$eigendecomp$vectors[, 1:2]) %>%
mutate(func = unique(data$func)) %>%
pivot_longer(X1:X2, names_to = "phi") %>%
ggplot() +
geom_line(aes(x = func, y = value, color = phi)) +
labs(
x = "Time, t",
y = TeX("$\\phi_{2m}^{(2)}(t)$"),
color = TeX("$m$"),
title = "Group 2, Level 2 Eigenfunctions"
)